Earlier today, while reading my Twitter timeline, I saw some Infosec folks discussing about scripts/tools to identify RAW pictures in memory dumps. I decided, then, to write this blog post and share a small hack that I use to visualize data (including memory dumps).

A few months ago, I wrote a post detailing how to Scan the Internet & Screenshot All the Things, now it's time to Dump the Memory & Screenshot All the Things.

Memory Dumps
The first thing you will want to do is to narrow the analysis to the process containing interesting images/pictures. I'm going to use three different memory dumps here:
Remote Desktop Client - Windows 7 x64 (mstsc.exe)
Let's use the Windows built-in RDP client to connect to an external server and dump the process
memory using procdump:

procdump.exe -ma mstsc.exe mstsc.dmp

Microsoft Paint - Windows 7 x64 (mspaint.exe)
Let's load/save a simple image file on Paint and run procdump again:

procdump.exe -ma mspaint.exe mspaint.dmp

9447 2014 CTF Challenge: coor coor - Windows XP (VirtualBox.exe)
There's an awesome write-up for this CTF challenge here, go read it now if you haven't yet. We are going to use volatility to isolate the VirtualBox memory dump:
python vol.py -f challenge.vmem pslist

python vol.py -f challenge.vmem memdump -p 1568 --dump-dir=dump/

RAW Image Data
Rename the file extensions from *.dmp to *.data, download/install GIMP and open them as "RAW Image Data":

That's it, now you can use GIMP to navigate within the memory dump and analyse the rendered pixels/bitmaps on their corresponding offsets. It's worth mentioning that different images will be rendered using different Image types and variable widths: you may need to adjust these values accordingly.
So what can we spot here?
- On the RDP memory dump, we can retrieve the tiles and Windows displayed during the connection, including IP's, usernames and commands:
 |
| Windows commands |
 |
| Remote Desktop Client Window |
 |
| RDP session |
- The Microsoft Paint picture can be easily spotted: they're upside down because that's the way BMP's are stored:
 |
| We need upside down backdoors "this big" |
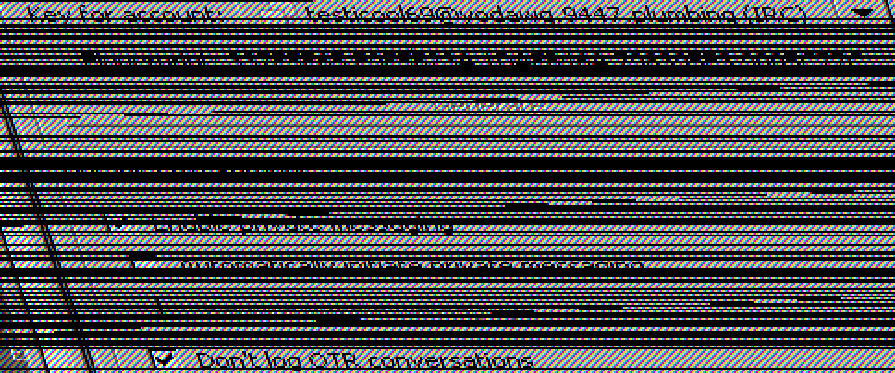
- The most interesting artifacts were collected from the Coor Coor dump. The user was running a TrueCrypt container inside VirtualBox and after some offset adjustment we can see the Pidgin Window, the user account (testicool69@yodawg.9447.plumbing) and a few OTR settings:
 |
| While True: width ++ || width-- |
Notice that the Windows are not perfectly aligned here, but we can see the data by zooming in:
 |
| Enhance pls |
 |
| Looks like our killer is screwed. YEEAAAH. |
We can also spot the Window taskbar, just like the volatility screenshot plugin showed us on the previous write-up:

 |
| python vol.py -f challenge.vmem screenshot -D screenshot/ |
It's also possible to spot icons from the running programs, like this one from Virtualbox:
 |
| VirtualBox icon |
Conclusion
This technique is very common among ROM hackers as they try to find image patterns inside raw game dumps. Check my write-up from Hack.lu 2014 CTF to find more about it. By the way, you can also use Tile Molester instead of GIMP to browse the RAW data.
As far as I know, there's no off-the-shelf tool to automagically extract them, but it should't be that hard to write a binwalk/volatility plugin for this based on some heuristics. Binwalk, for example, can find raw deflate/lzma streams by building headers on top of the raw compressed data and writing it back do disk.
I'm no Computer Visualization expert, but here's a few suggestions:
- Set the image width to common display resolutions. The taskbar from the coor coor memory dump could be displayed by setting the width to 1440 points (1440x900 is a common screen resolution).
- Use common window background/patterns as a template to find interesting sections.
- Create a multi-view/side-by-side RAW image browser based on GIMP source code (multiple image types, multiple widths etc).
- Use Google's artificial brain to find cat videos.
- Get a bigger monitor (yeah, it helps).
I hope you all use these skills wisely, avoiding any kind of superfishal investigation like our Lenovo friends.


